Go, Graphs and Graphviz
Preparing for my latest interview this past summer, had me working with graphs again. I’m also trying to make some time to toy around with dgraph; I kind of enjoy dealing with that type of problems, mainly for those breakthrough a-ha! moments that come around once every while.
Building a simple graph in Go, is straightforward, but a visual representation is immensely helpful to get a quick overview and investigate edge-cases (no pun intended).
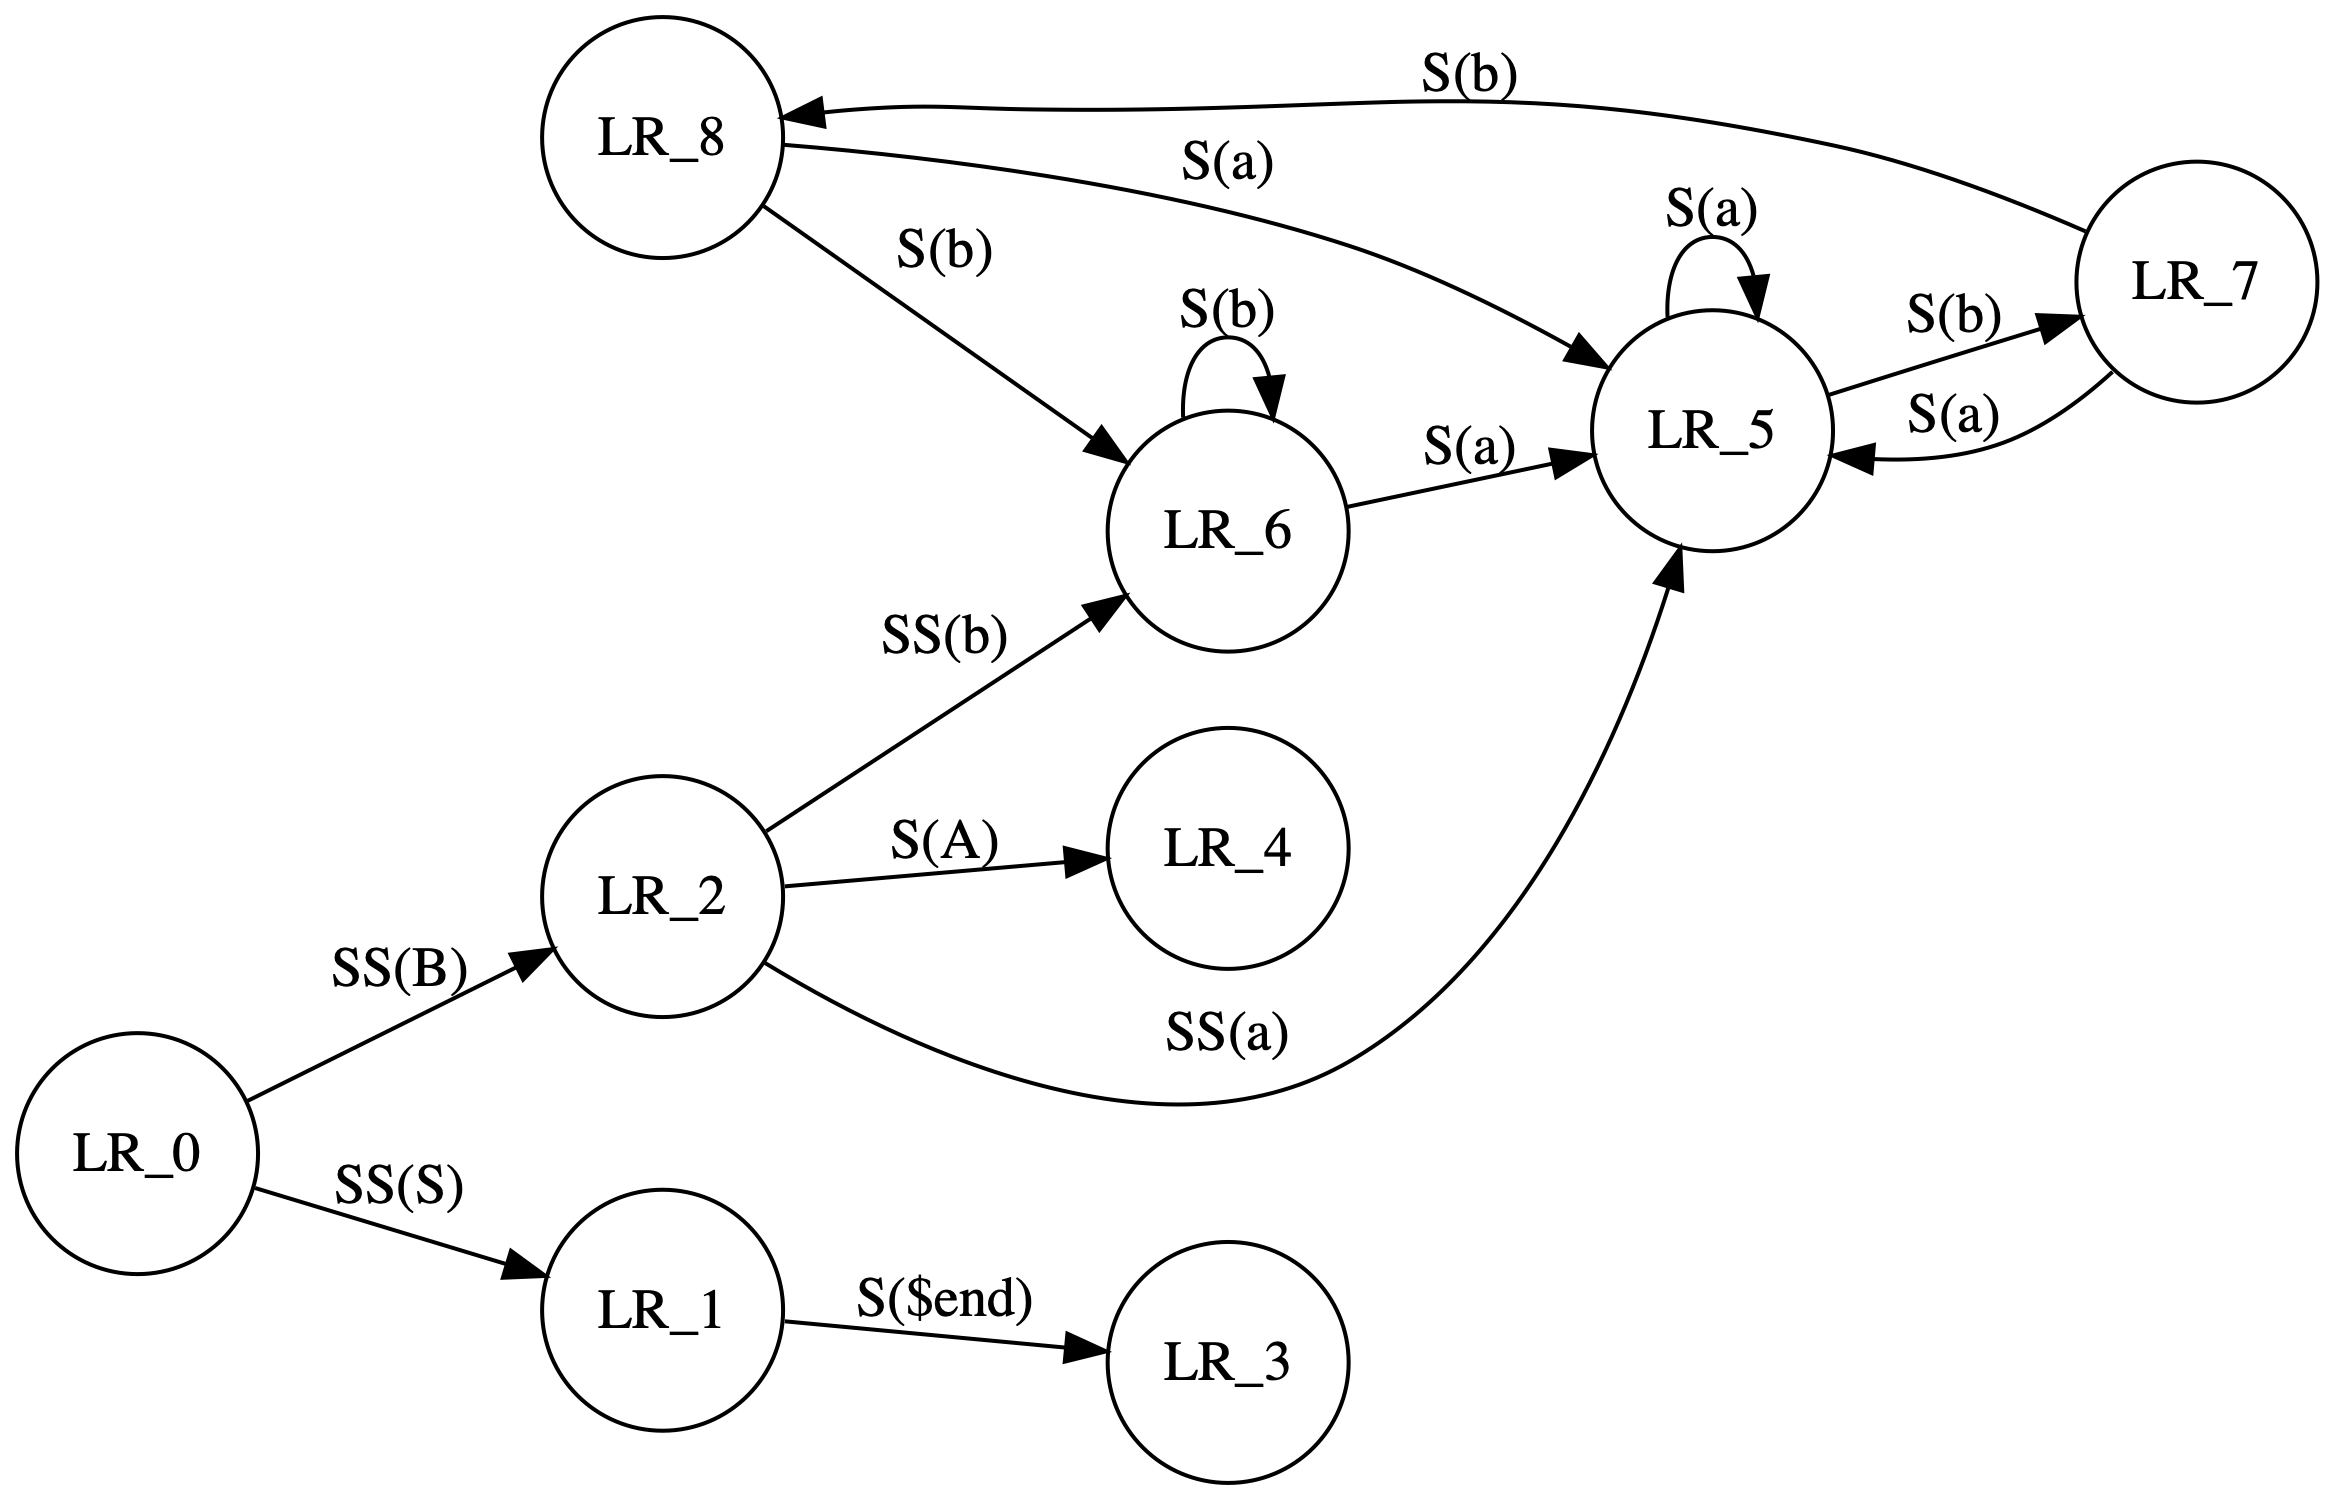
Unfortunately, many of the solutions I found were a little cumbersome, but why not use the magic of Graphviz? Let’s go through a demonstration of our own, without no external packages required! We’re going to recreate this example.
First off, we define the graph properties, the edges, the nodes, and a couple of helpers function.
Afterwards, we’ll define a simple Stringer interface for our graph and its edges, which we can then pipe to Graphviz.
Hope this doesn’t contain any glaring errors, as it was whipped up in a couple of minutes, seems to be working for most basic cases.
package main

import "fmt"

type edge struct {
	node  string
	label string
}
type graph struct {
	nodes map[string][]edge
}

func newGraph() *graph {
	return &graph{nodes: make(map[string][]edge)}
}

func (g *graph) addEdge(from, to, label string) {
	g.nodes[from] = append(g.nodes[from], edge{node: to, label: label})
}

func (g *graph) getEdges(node string) []edge {
	return g.nodes[node]
}

func (e *edge) String() string {
	return fmt.Sprintf("%v", e.node)
}

func (g *graph) String() string {
	out := `digraph finite_state_machine {
		rankdir=LR;
		size="8,5"
		node [shape = circle];`
	for k := range g.nodes {
		for _, v := range g.getEdges(k) {
			out += fmt.Sprintf("\t%s -> %s\t[ label = \"%s\" ];\n", k, v.node, v.label)
		}
	}
	out += "}"
	return out
}

func main() {
	g := newGraph()
	// https://graphviz.gitlab.io/_pages/Gallery/directed/fsm.html

	g.addEdge("LR_0", "LR_2", "SS(B)")
	g.addEdge("LR_0", "LR_1", "SS(S)")
	g.addEdge("LR_1", "LR_3", "S($end)")
	g.addEdge("LR_2", "LR_6", "SS(b)")
	g.addEdge("LR_2", "LR_5", "SS(a)")
	g.addEdge("LR_2", "LR_4", "S(A)")
	g.addEdge("LR_5", "LR_7", "S(b)")
	g.addEdge("LR_5", "LR_5", "S(a)")
	g.addEdge("LR_6", "LR_6", "S(b)")
	g.addEdge("LR_6", "LR_5", "S(a)")
	g.addEdge("LR_7", "LR_8", "S(b)")
	g.addEdge("LR_7", "LR_5", "S(a)")
	g.addEdge("LR_8", "LR_6", "S(b)")
	g.addEdge("LR_8", "LR_5", "S(a)")

	fmt.Println(g)
}
We now can do something like
$ go run main.go > mygraph.dot
$ dot -Tps mygraph.dot -o mygraph.ps
$ dot -Tpng -Gdpi=300 mygraph.dot > mygraph.png
The result is a beautiful vector image that looks like


That’s all for now!